See it in action
What the diagnosis looks like
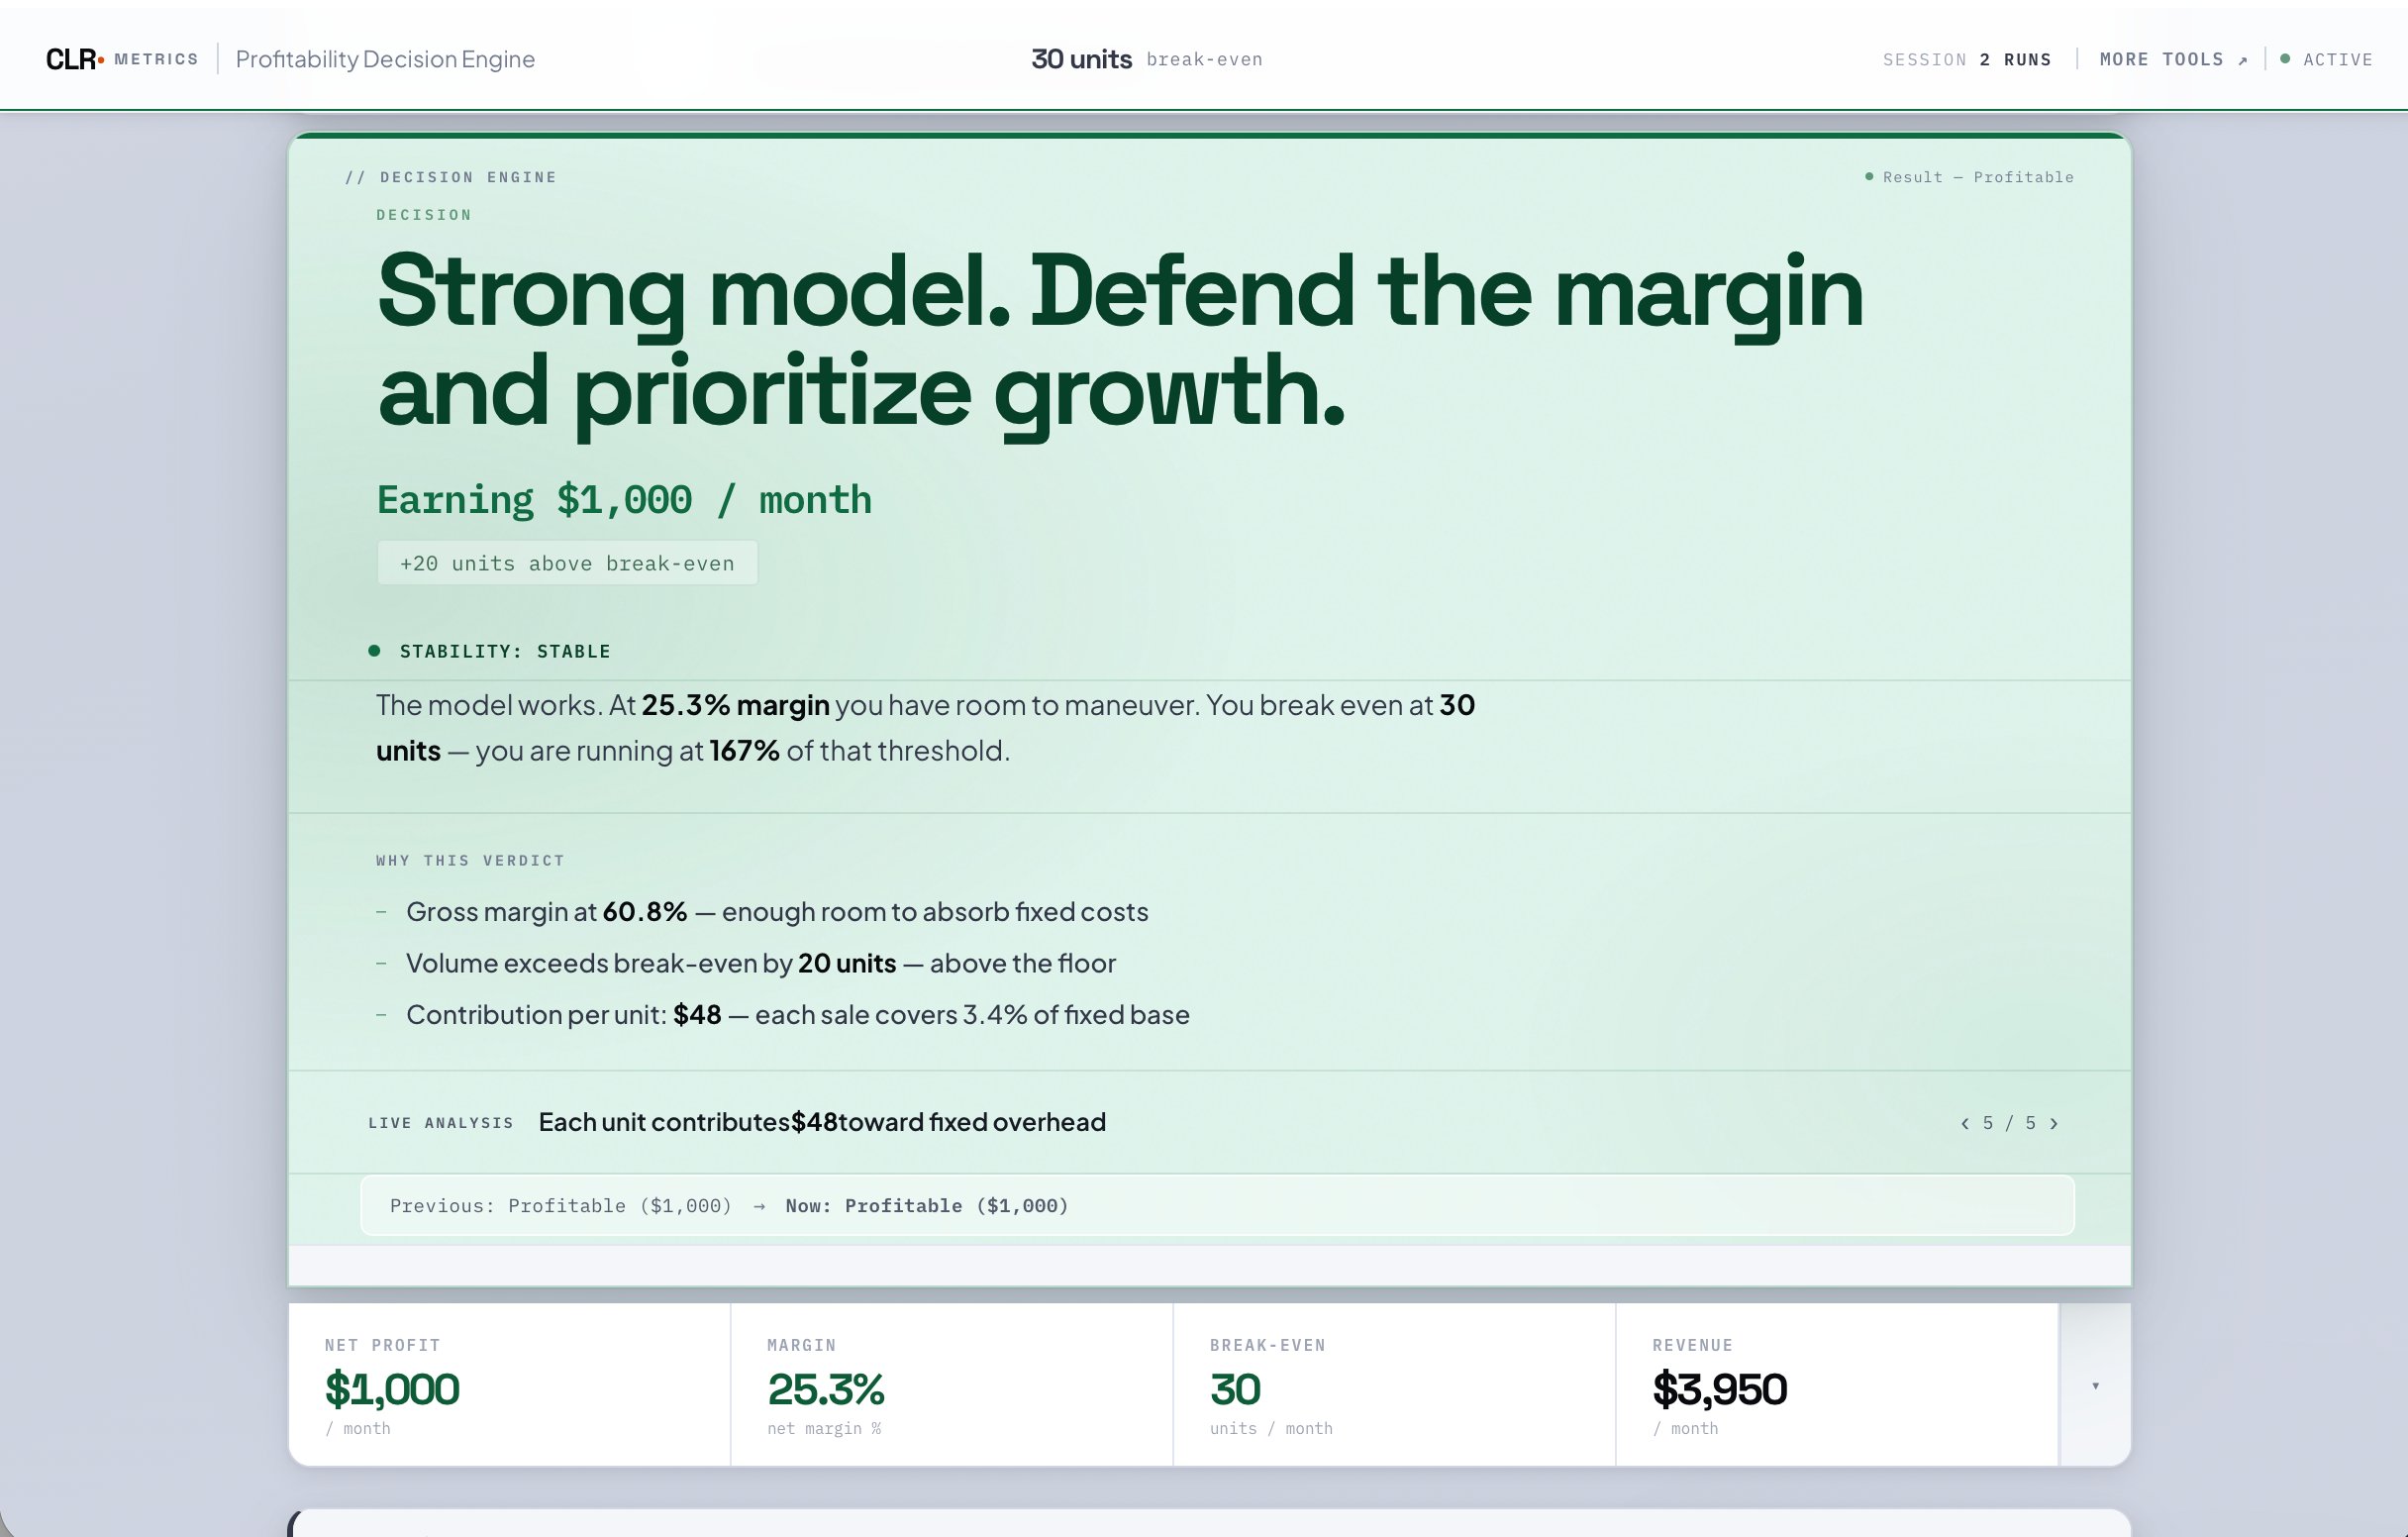
Real output from the tool. This is exactly what you get.
1 / 5
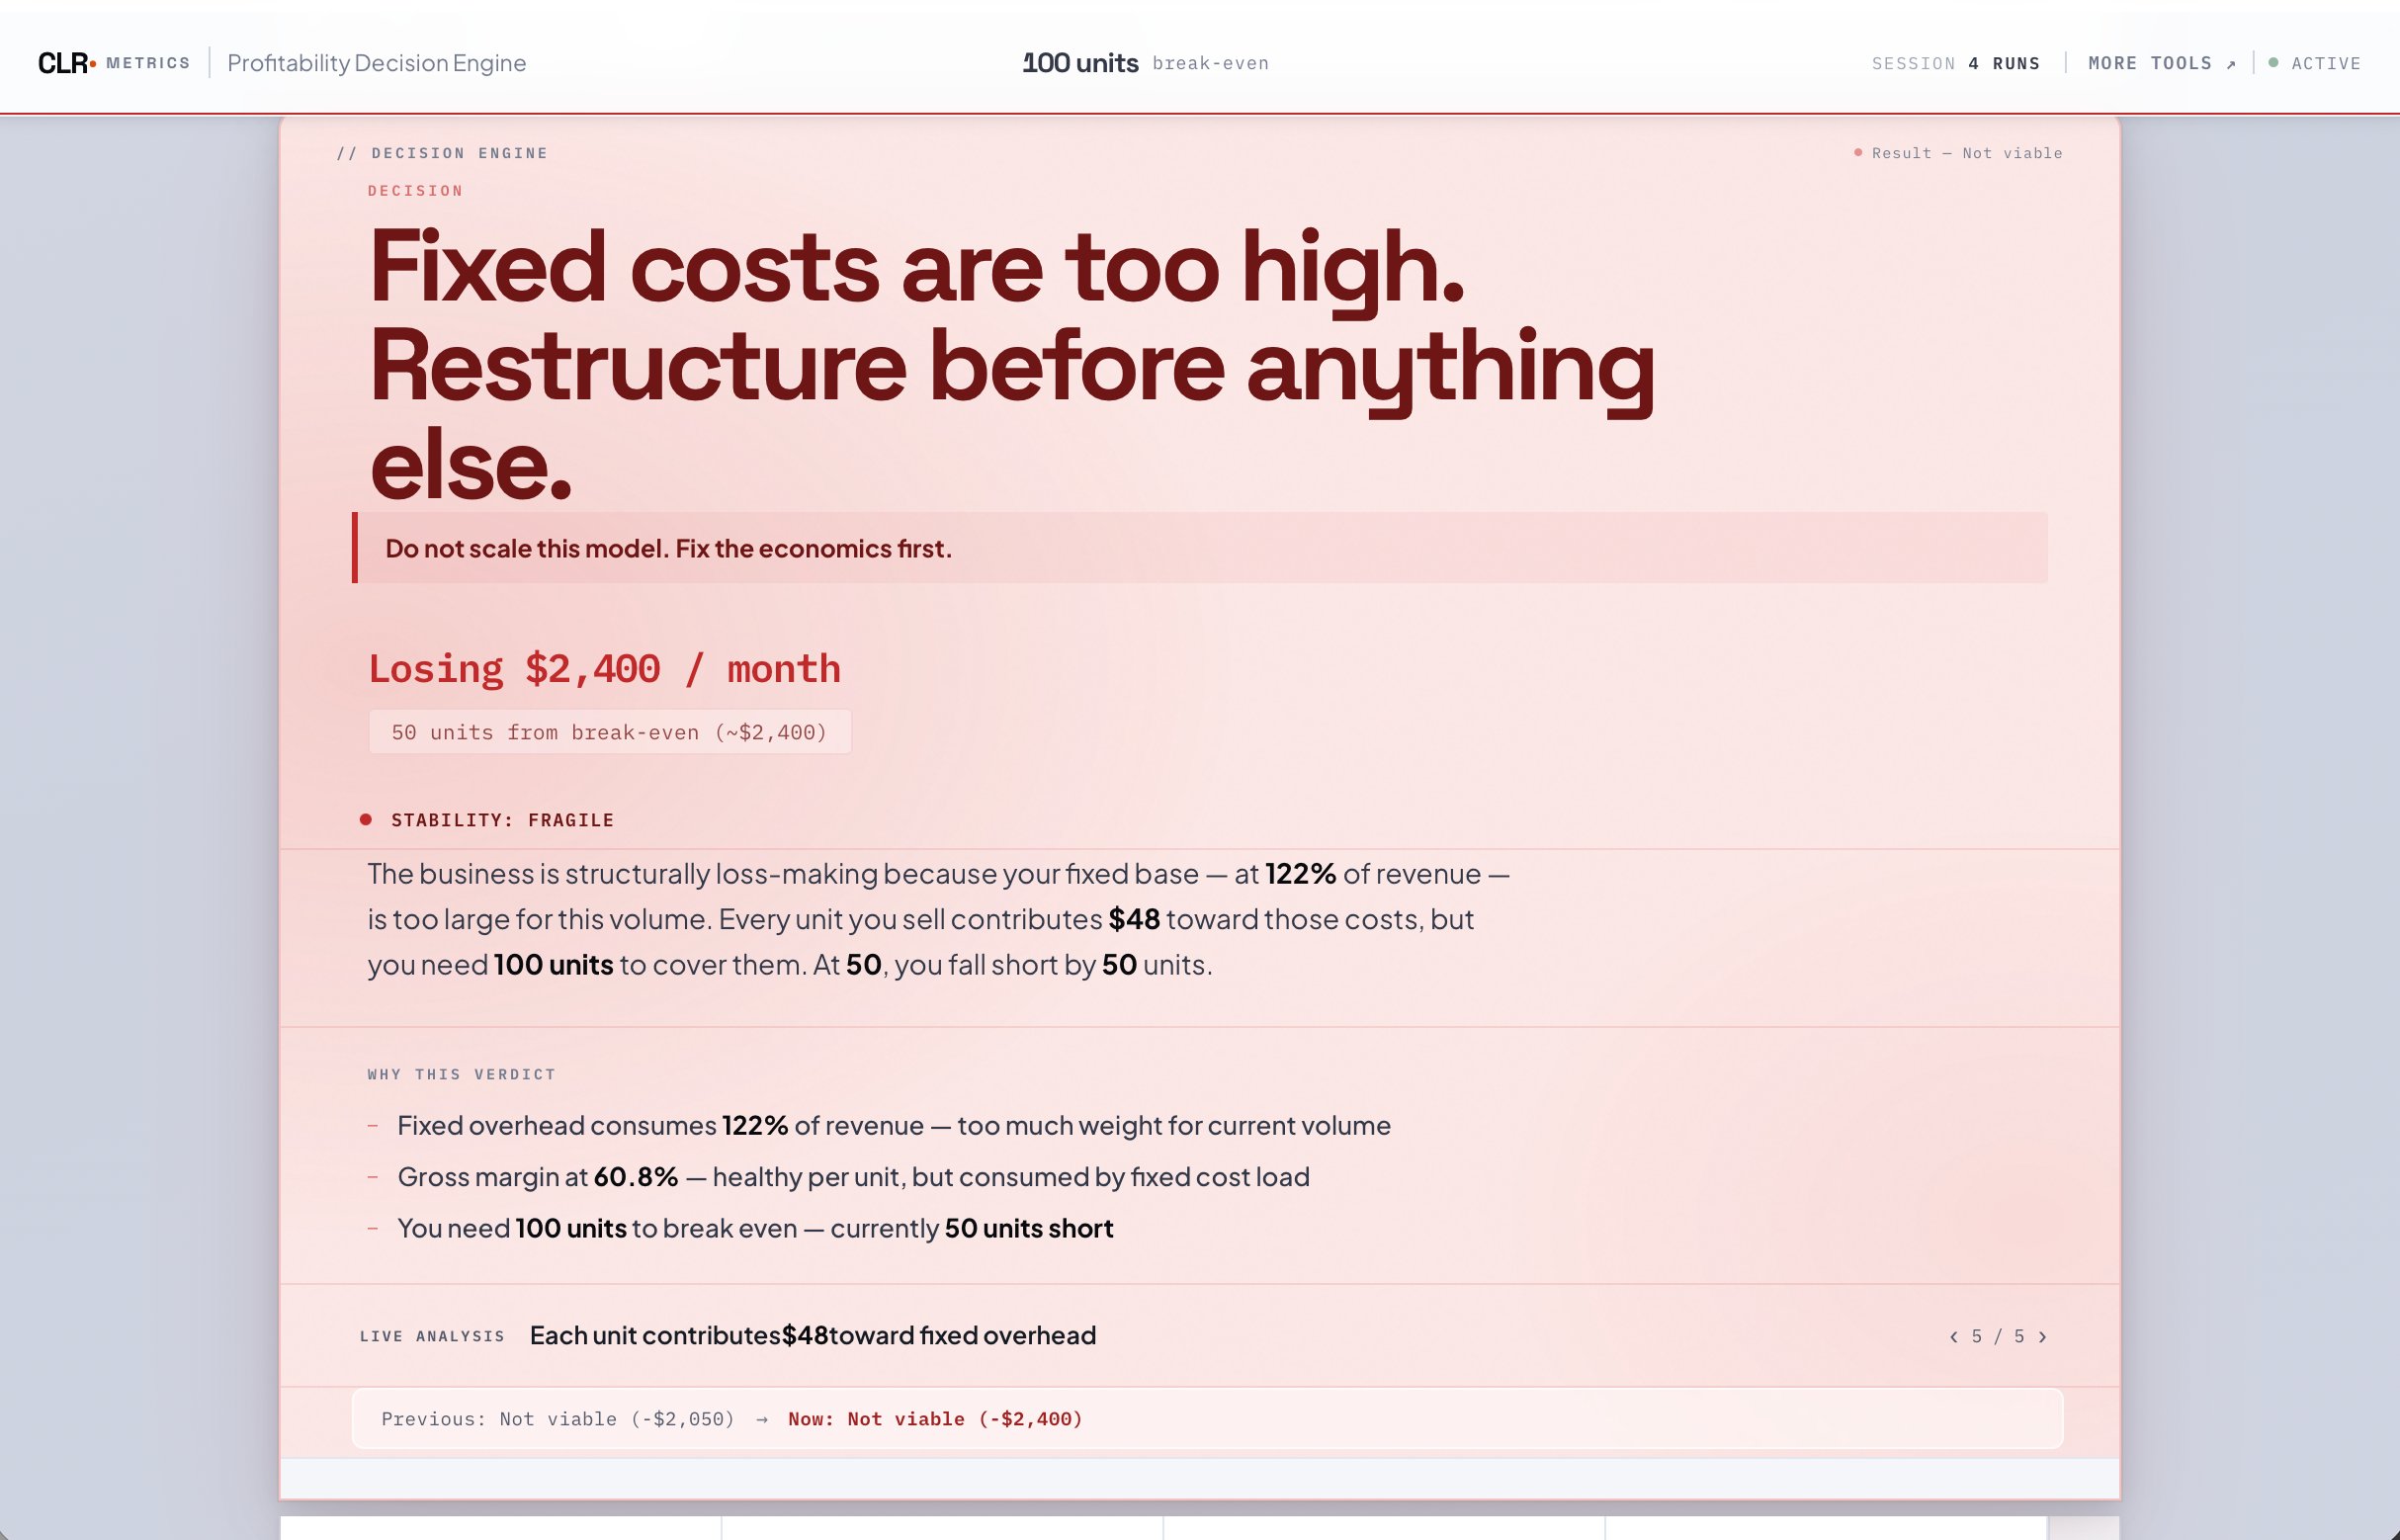
LOSS — Fixed costs are too high. Restructure before anything else.
Most business decisions happen before the numbers are clear.
That's what this fixes.
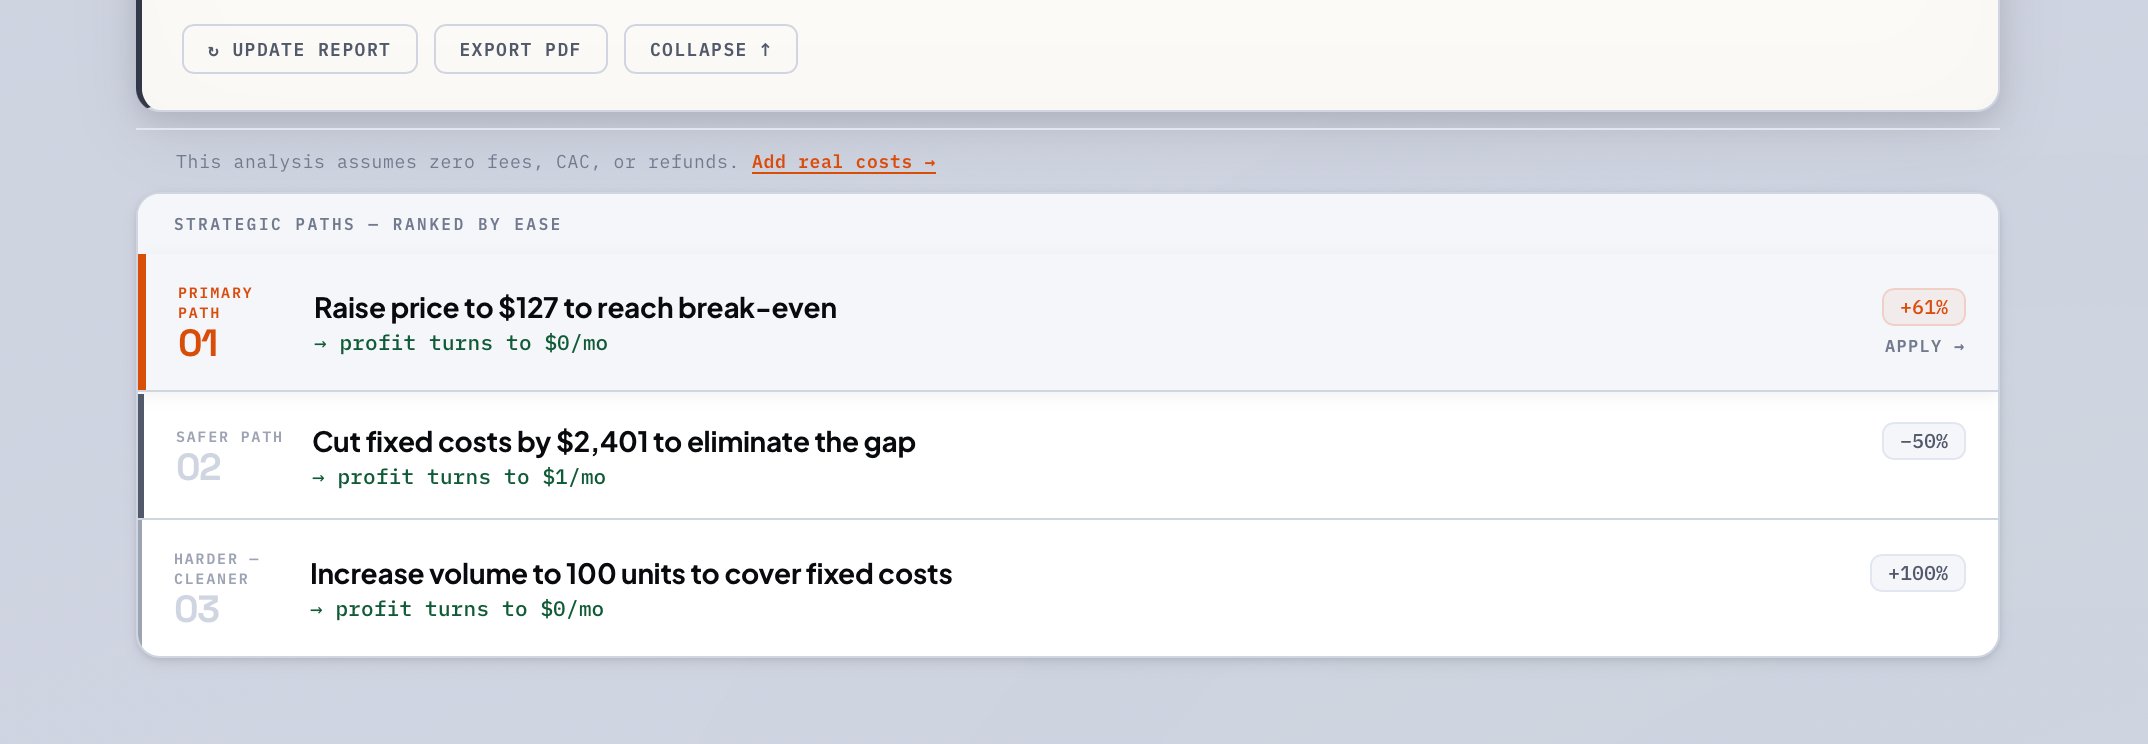
Enter price, cost, volume, fixed costs. Get a written diagnosis: what's happening, what breaks first, and the exact move that fixes it.
No account required. Works in any browser. Results in under a minute.
Find what's breaking your model → Just need the Excel? → $12Real output from the tool. This is exactly what you get.
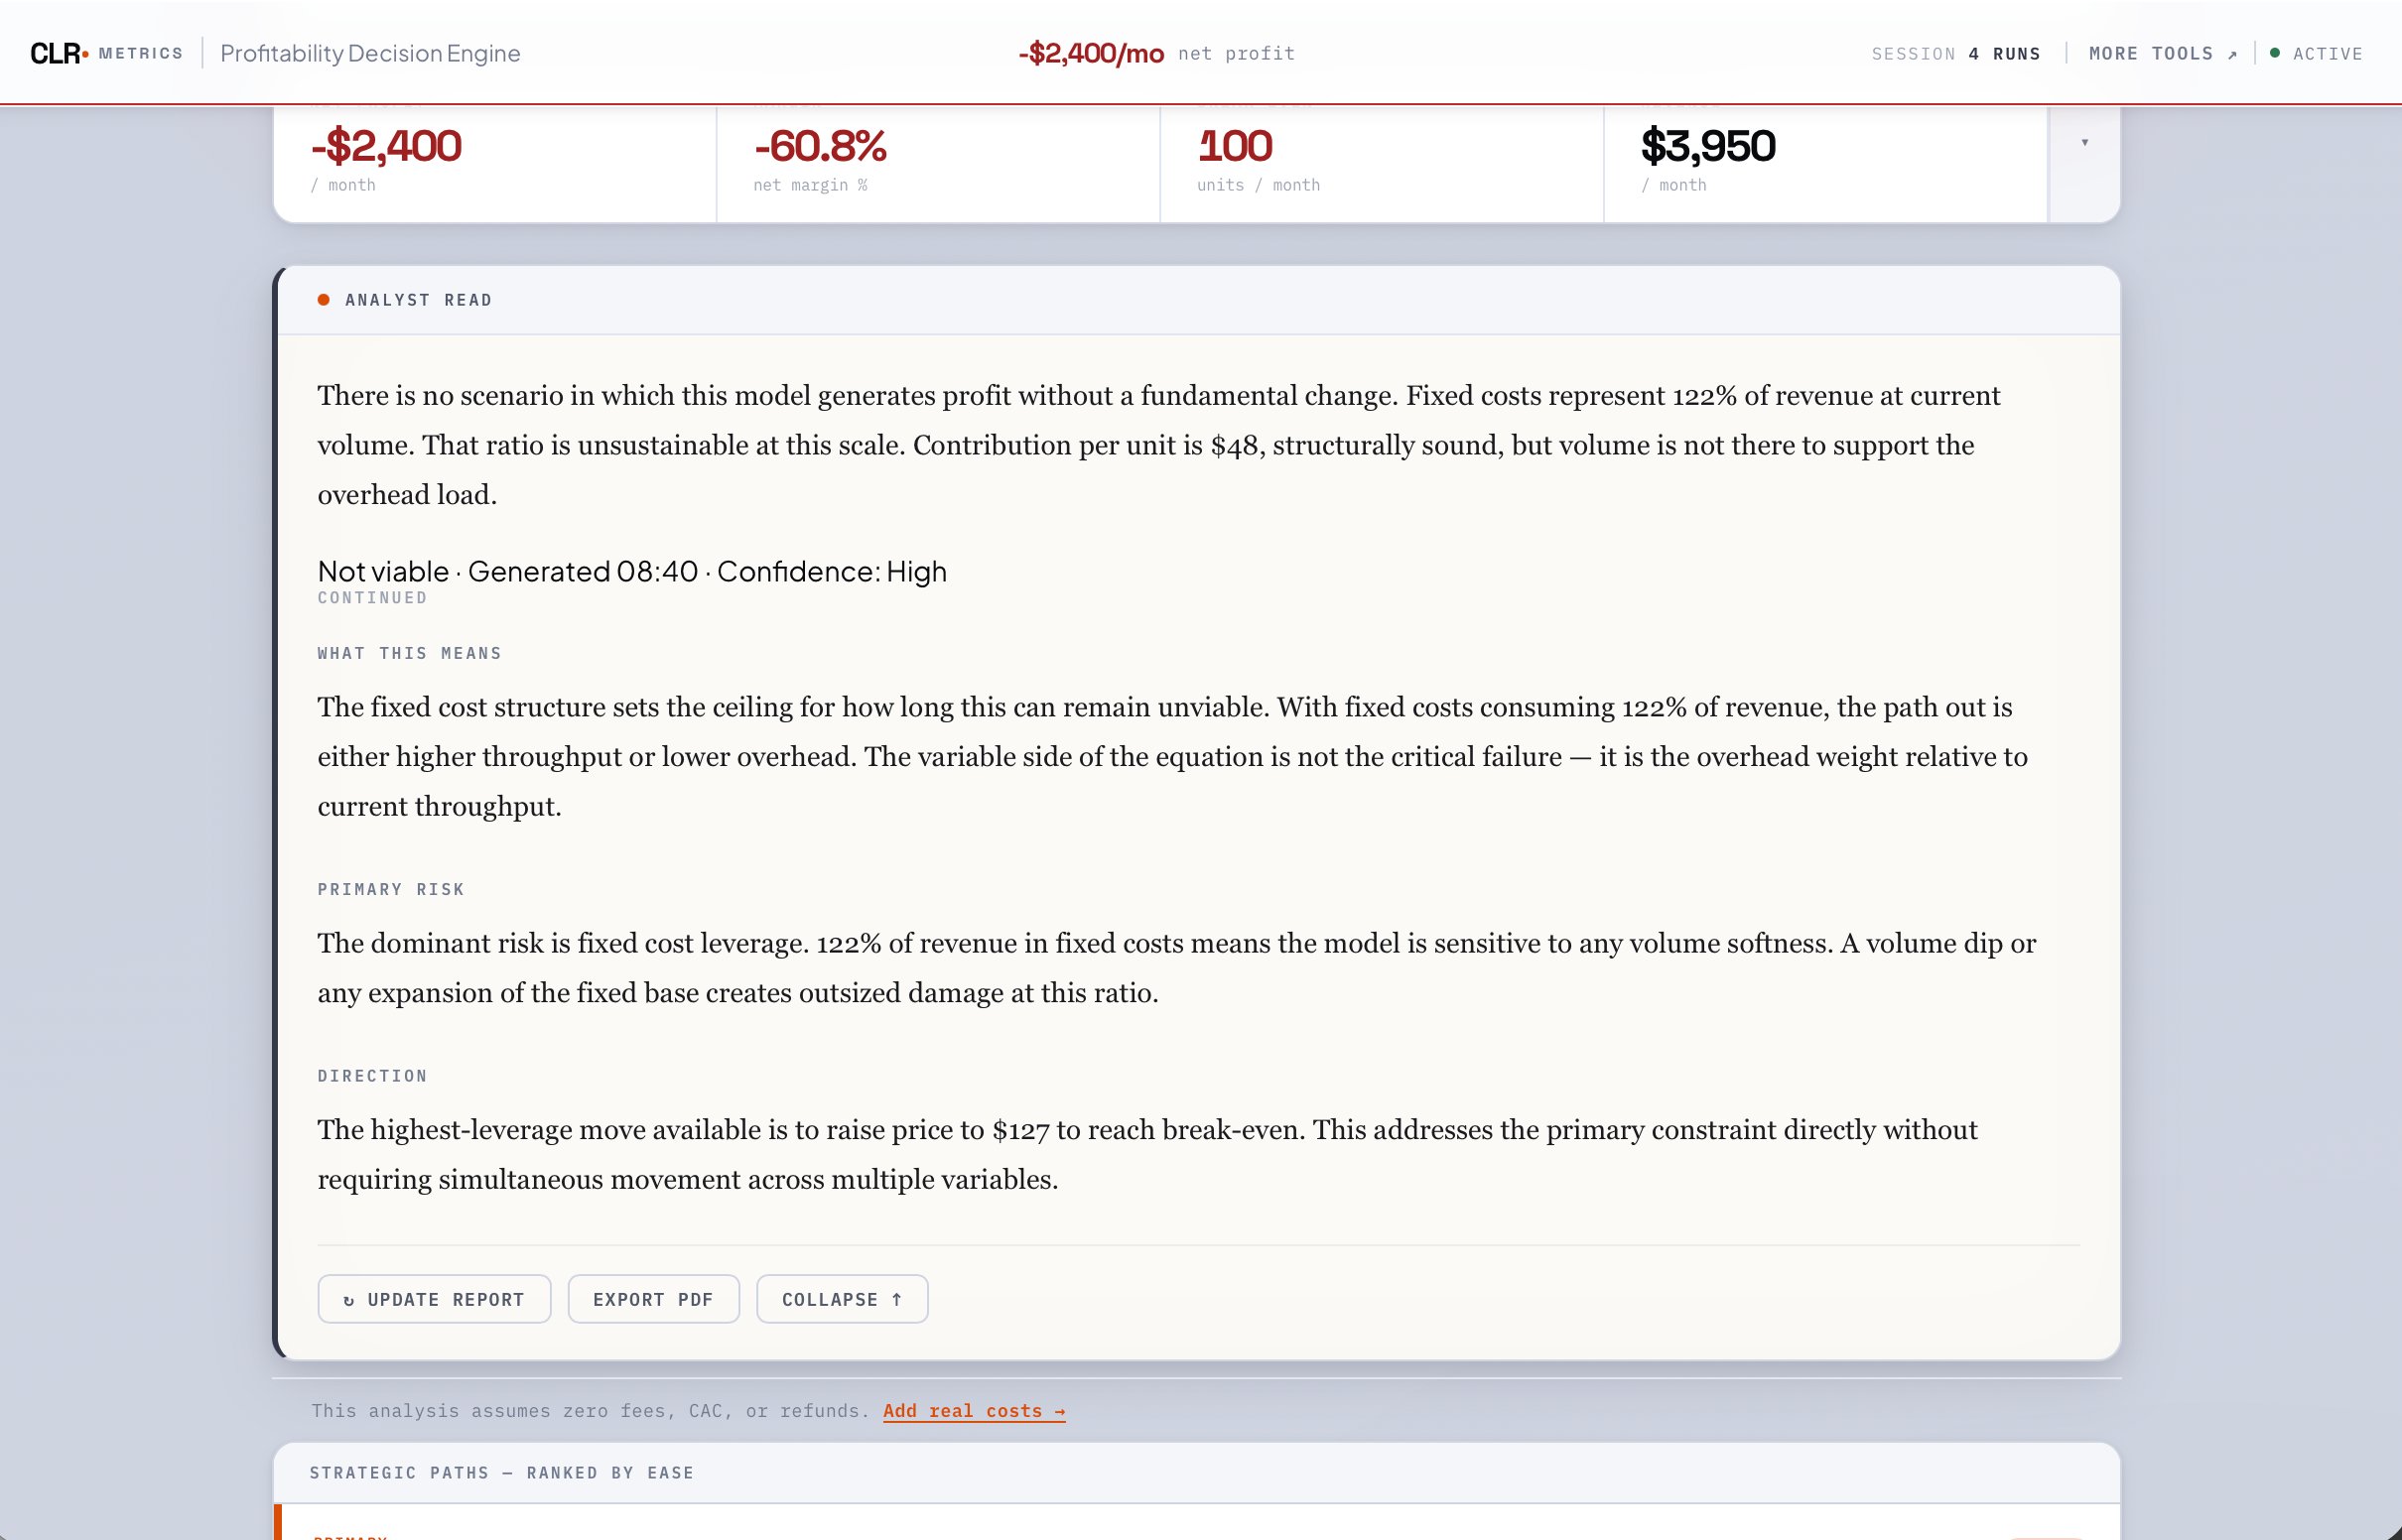
Numbers tell you what happened. The engine tells you what it means — and what to do next.
Two tools, one system. Choose what fits the decision.
Works in any browser. Instant access. Lifetime use.